
Discovering Your Personal and Team WHY.os eBook
This eBook is your roadmap to clarity, success, and meaningful relationships in both personal and professional spheres. Learn to navigate life and work with purpose, leveraging your core motivations to achieve unprecedented growth and harmony within your team.

MASTER THE NEXT 90: SNEAK PEEK eBook
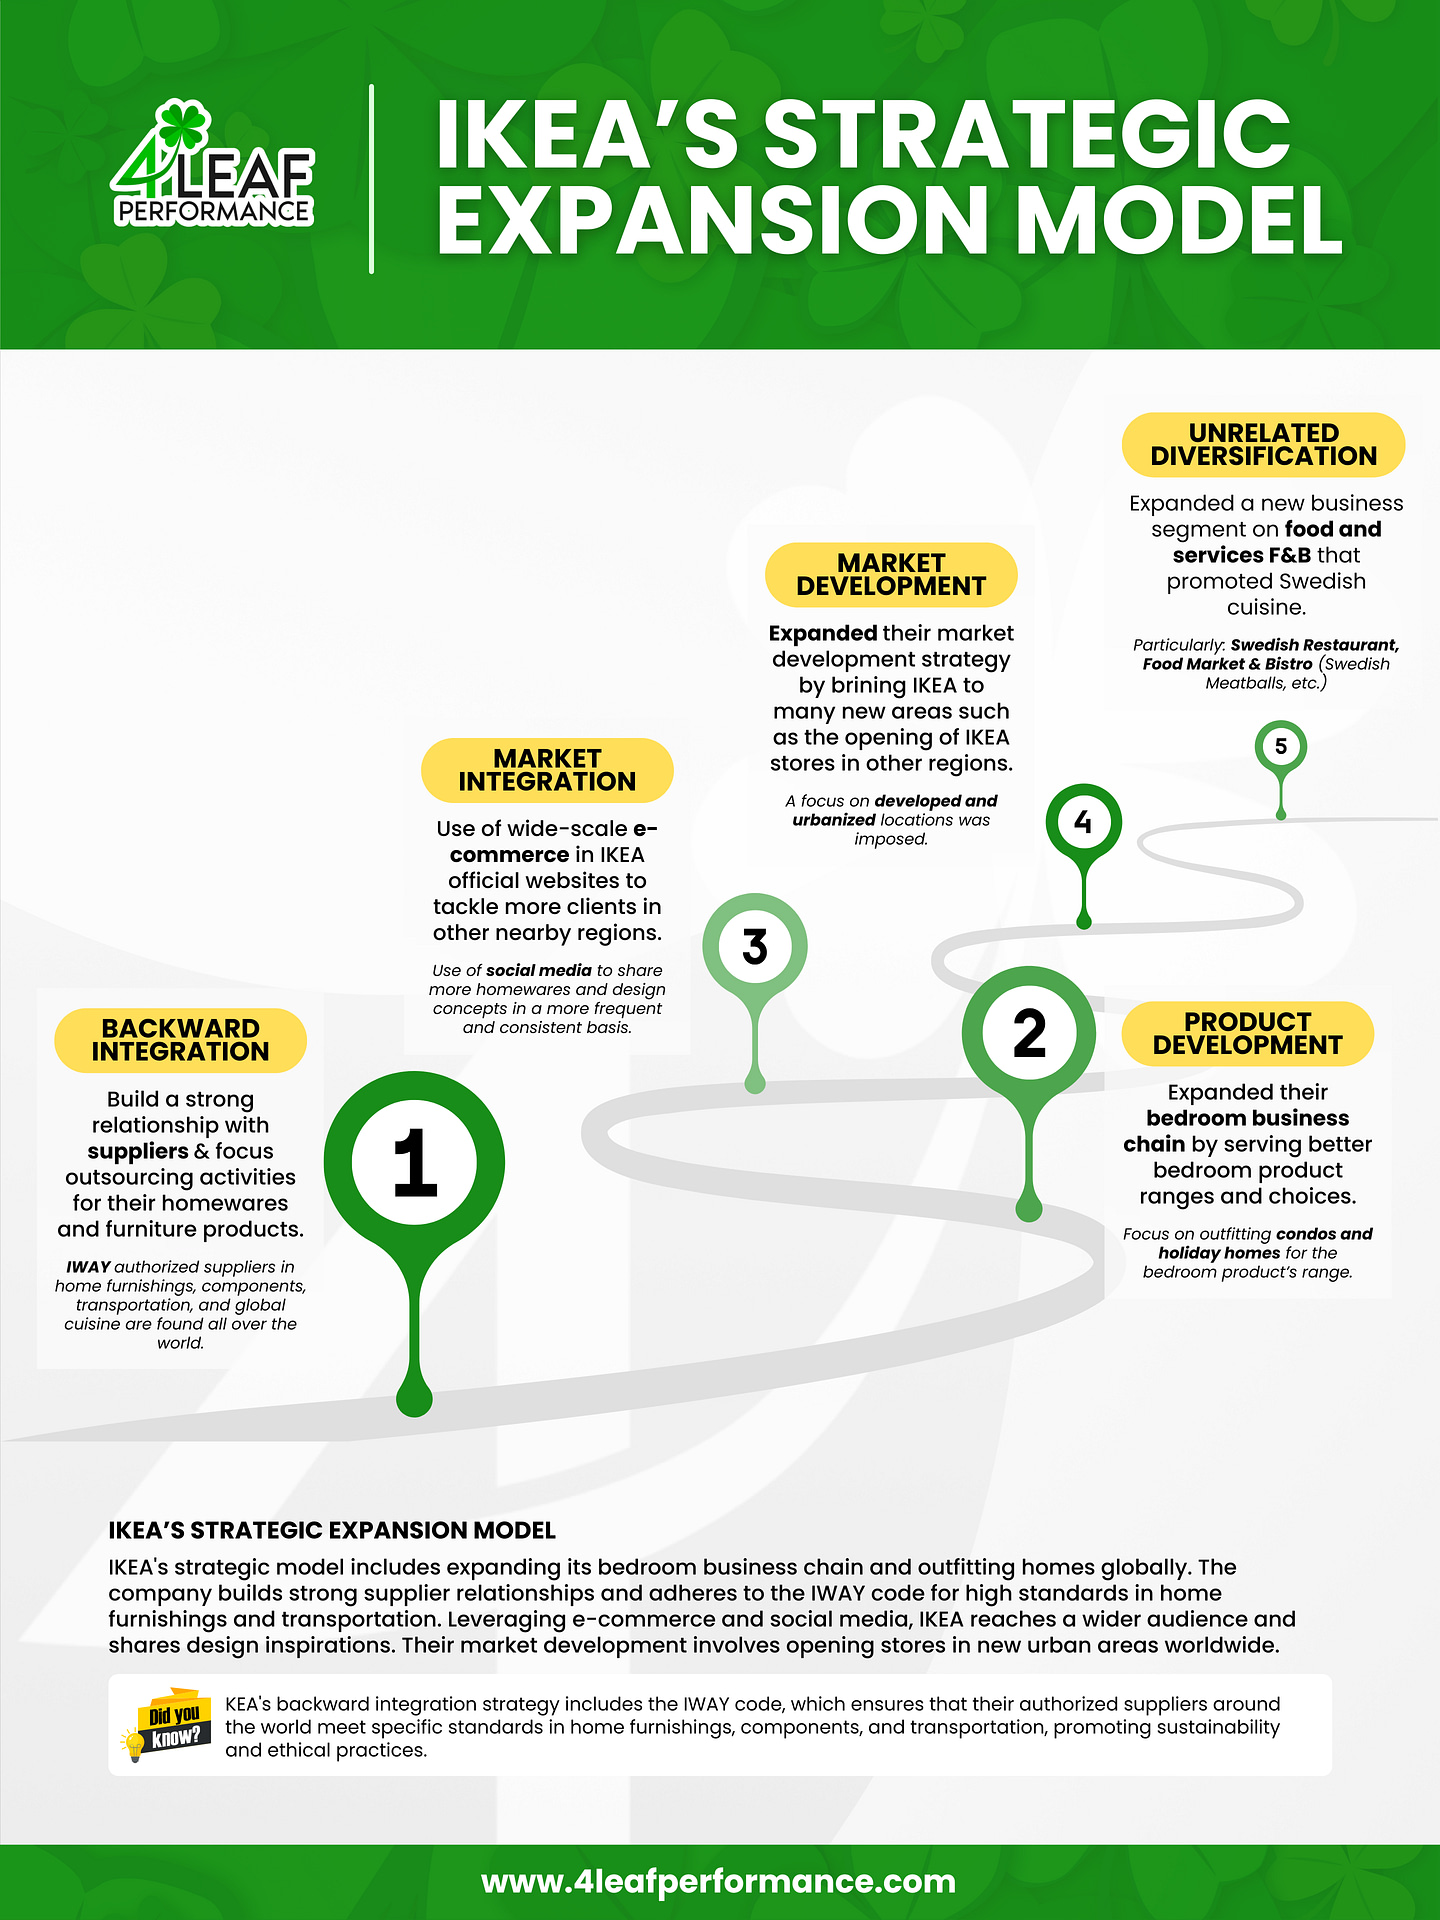
“Master the Next 90: Sneak Peek!” is your essential guide to transforming your business into a well-oiled machine. This ebook provides practical strategies for mastering core competencies, defining your market niche, and leveraging assets for growth.!